Google shut down Universal Analytics in July 2024. The data is gone, the interface is gone, and the metrics your clients spent years referencing no longer exist in their original form. GA4 replaced it, and most agencies made the switch. The problem is that clients did not get a memo.
When you send a report showing 8,200 sessions this month and your client remembers their UA dashboard showing 14,000 sessions last year, they do not think “that makes sense, the methodology changed.” They think the numbers went down. They think something is wrong. They ask why.
This guide covers what actually changed between UA and GA4, which metrics to focus on in client reports now, and how to explain the differences without losing the client's confidence in the process.
What Actually Changed Between UA and GA4
Universal Analytics was built around sessions and pageviews. A session was a group of interactions from a single user within a 30-minute window. A pageview was counted every time someone loaded a page. Simple, consistent, and something every agency and client understood after a few months of seeing the numbers.
GA4 is built around events. Everything is an event: page views, clicks, scrolls, video plays, form submissions. Sessions still exist, but they are calculated differently. Users are tracked differently. The measurement philosophy is fundamentally different, which is why the numbers do not match even when the actual traffic is identical.
Sessions count differently
In UA, a new session started after 30 minutes of inactivity or at midnight. In GA4, sessions are based on session_start events and work slightly differently around campaign attribution. The practical result is that GA4 typically reports fewer sessions than UA did for the same traffic, sometimes 10 to 30 percent fewer depending on the site.
Bounce rate is gone, replaced by engagement rate
UA's bounce rate measured the percentage of sessions where someone viewed only one page. GA4 replaced it with engagement rate, which measures sessions where someone spent at least 10 seconds on the site, viewed two or more pages, or triggered a conversion event. Engagement rate is essentially the inverse of bounce rate, but with a more generous threshold. A 70 percent engagement rate in GA4 is not the same as a 30 percent bounce rate in UA, even though the math might suggest it.
Users are counted differently
GA4 defaults to reporting active users rather than total users. An active user is someone who triggered an engagement event during the period. UA counted all users who visited, including those who arrived and left immediately. This further reduces the numbers clients see compared to what they remember from UA.
Direct and organic attribution shifted
GA4 handles channel attribution differently from UA, particularly around direct traffic and cross-channel credit. Some traffic that UA classified as organic search now appears as direct in GA4, and vice versa. If your client remembers strong organic numbers from UA, expect some questions about why the channel breakdown looks different now.
What Clients Actually See in Reports Now
The number one issue in client reporting post-GA4 migration is not the data accuracy. GA4 is accurate. The issue is that clients are comparing current GA4 numbers to remembered UA numbers, and the comparison does not hold up because the measurement method changed.
Here is what tends to happen. An agency sends a monthly report showing traffic metrics. The client looks at the sessions number and compares it to what they vaguely remember from two years ago. The current number looks lower. They flag it in a call or send an email asking if traffic dropped.
The correct response is not defensive. It is educational: GA4 measures sessions differently, the methodology changed industry-wide, and the right comparison is GA4 this month against GA4 last month, not GA4 now against UA then. Period-over-period comparisons within GA4 are meaningful. Cross-platform comparisons are not.
Which Metrics to Show Clients in GA4 Reports
Not every GA4 metric belongs in a client report. GA4 gives you a significant amount of data, and most clients are not analysts. The goal is to show them what they need to evaluate whether their digital presence is moving in the right direction.
Keep in client reports
- Sessions: Still the primary traffic indicator. Explain once that GA4 sessions run slightly lower than UA sessions due to methodology differences, then move on and track trend over time.
- Engagement rate: More meaningful than bounce rate once clients understand it. A rising engagement rate indicates visitors are finding what they came for.
- New users vs returning users: Helps clients understand whether they are acquiring new visitors or retaining existing ones. Both matter, but for different reasons depending on the business.
- Top pages by views: Clients want to know what content is working. A simple ranked list of top pages answers that question clearly.
- Traffic sources: Organic, direct, social, referral. Showing channel breakdown helps clients understand where their visitors are coming from and evaluate marketing channel performance.
- Period-over-period change: Every metric should be shown alongside the previous period. A number without context is just a number. A number alongside last month or last quarter becomes a signal.
Leave out of client reports
- Average engagement time per session: Clients tend to read low averages as bad news even when the context is complex. Unless content depth is a specific KPI, leave this out.
- Events by event name: GA4 tracks dozens of event types automatically. Most of them are noise in a client report. Surface only the events that map to business goals.
- Raw user counts with no context: A user number on its own means nothing. Show it as part of a trend or alongside a goal.
How to Explain GA4 to Clients Who Remember UA
Most clients do not need a technical explanation of how GA4 works. They need enough context to stop comparing the wrong numbers and start trusting the right ones.
A one-paragraph note in the first report after migration handles most of this. Something like: “Google updated how they measure website traffic in 2024. The new system counts sessions slightly differently, which means the numbers are not directly comparable to older reports. The most useful comparison going forward is month-over-month and year-over-year within the new system.” That is usually enough.
For clients who push back and want to understand more, the engagement rate explanation tends to land well. Tell them UA measured how many people left immediately, and GA4 measures how many people actually engaged with the site. Frame GA4 as a better measurement of real interest, not a different way of counting the same thing. That reframes the comparison and usually ends the conversation.
Automating GA4 Reporting Across Clients
Once you know which GA4 metrics belong in your client reports, the next step is getting that data out without rebuilding the report manually every month. GA4's native reporting interface is not designed for client-facing output. It requires logins, it shows too much, and it does not carry your agency brand.
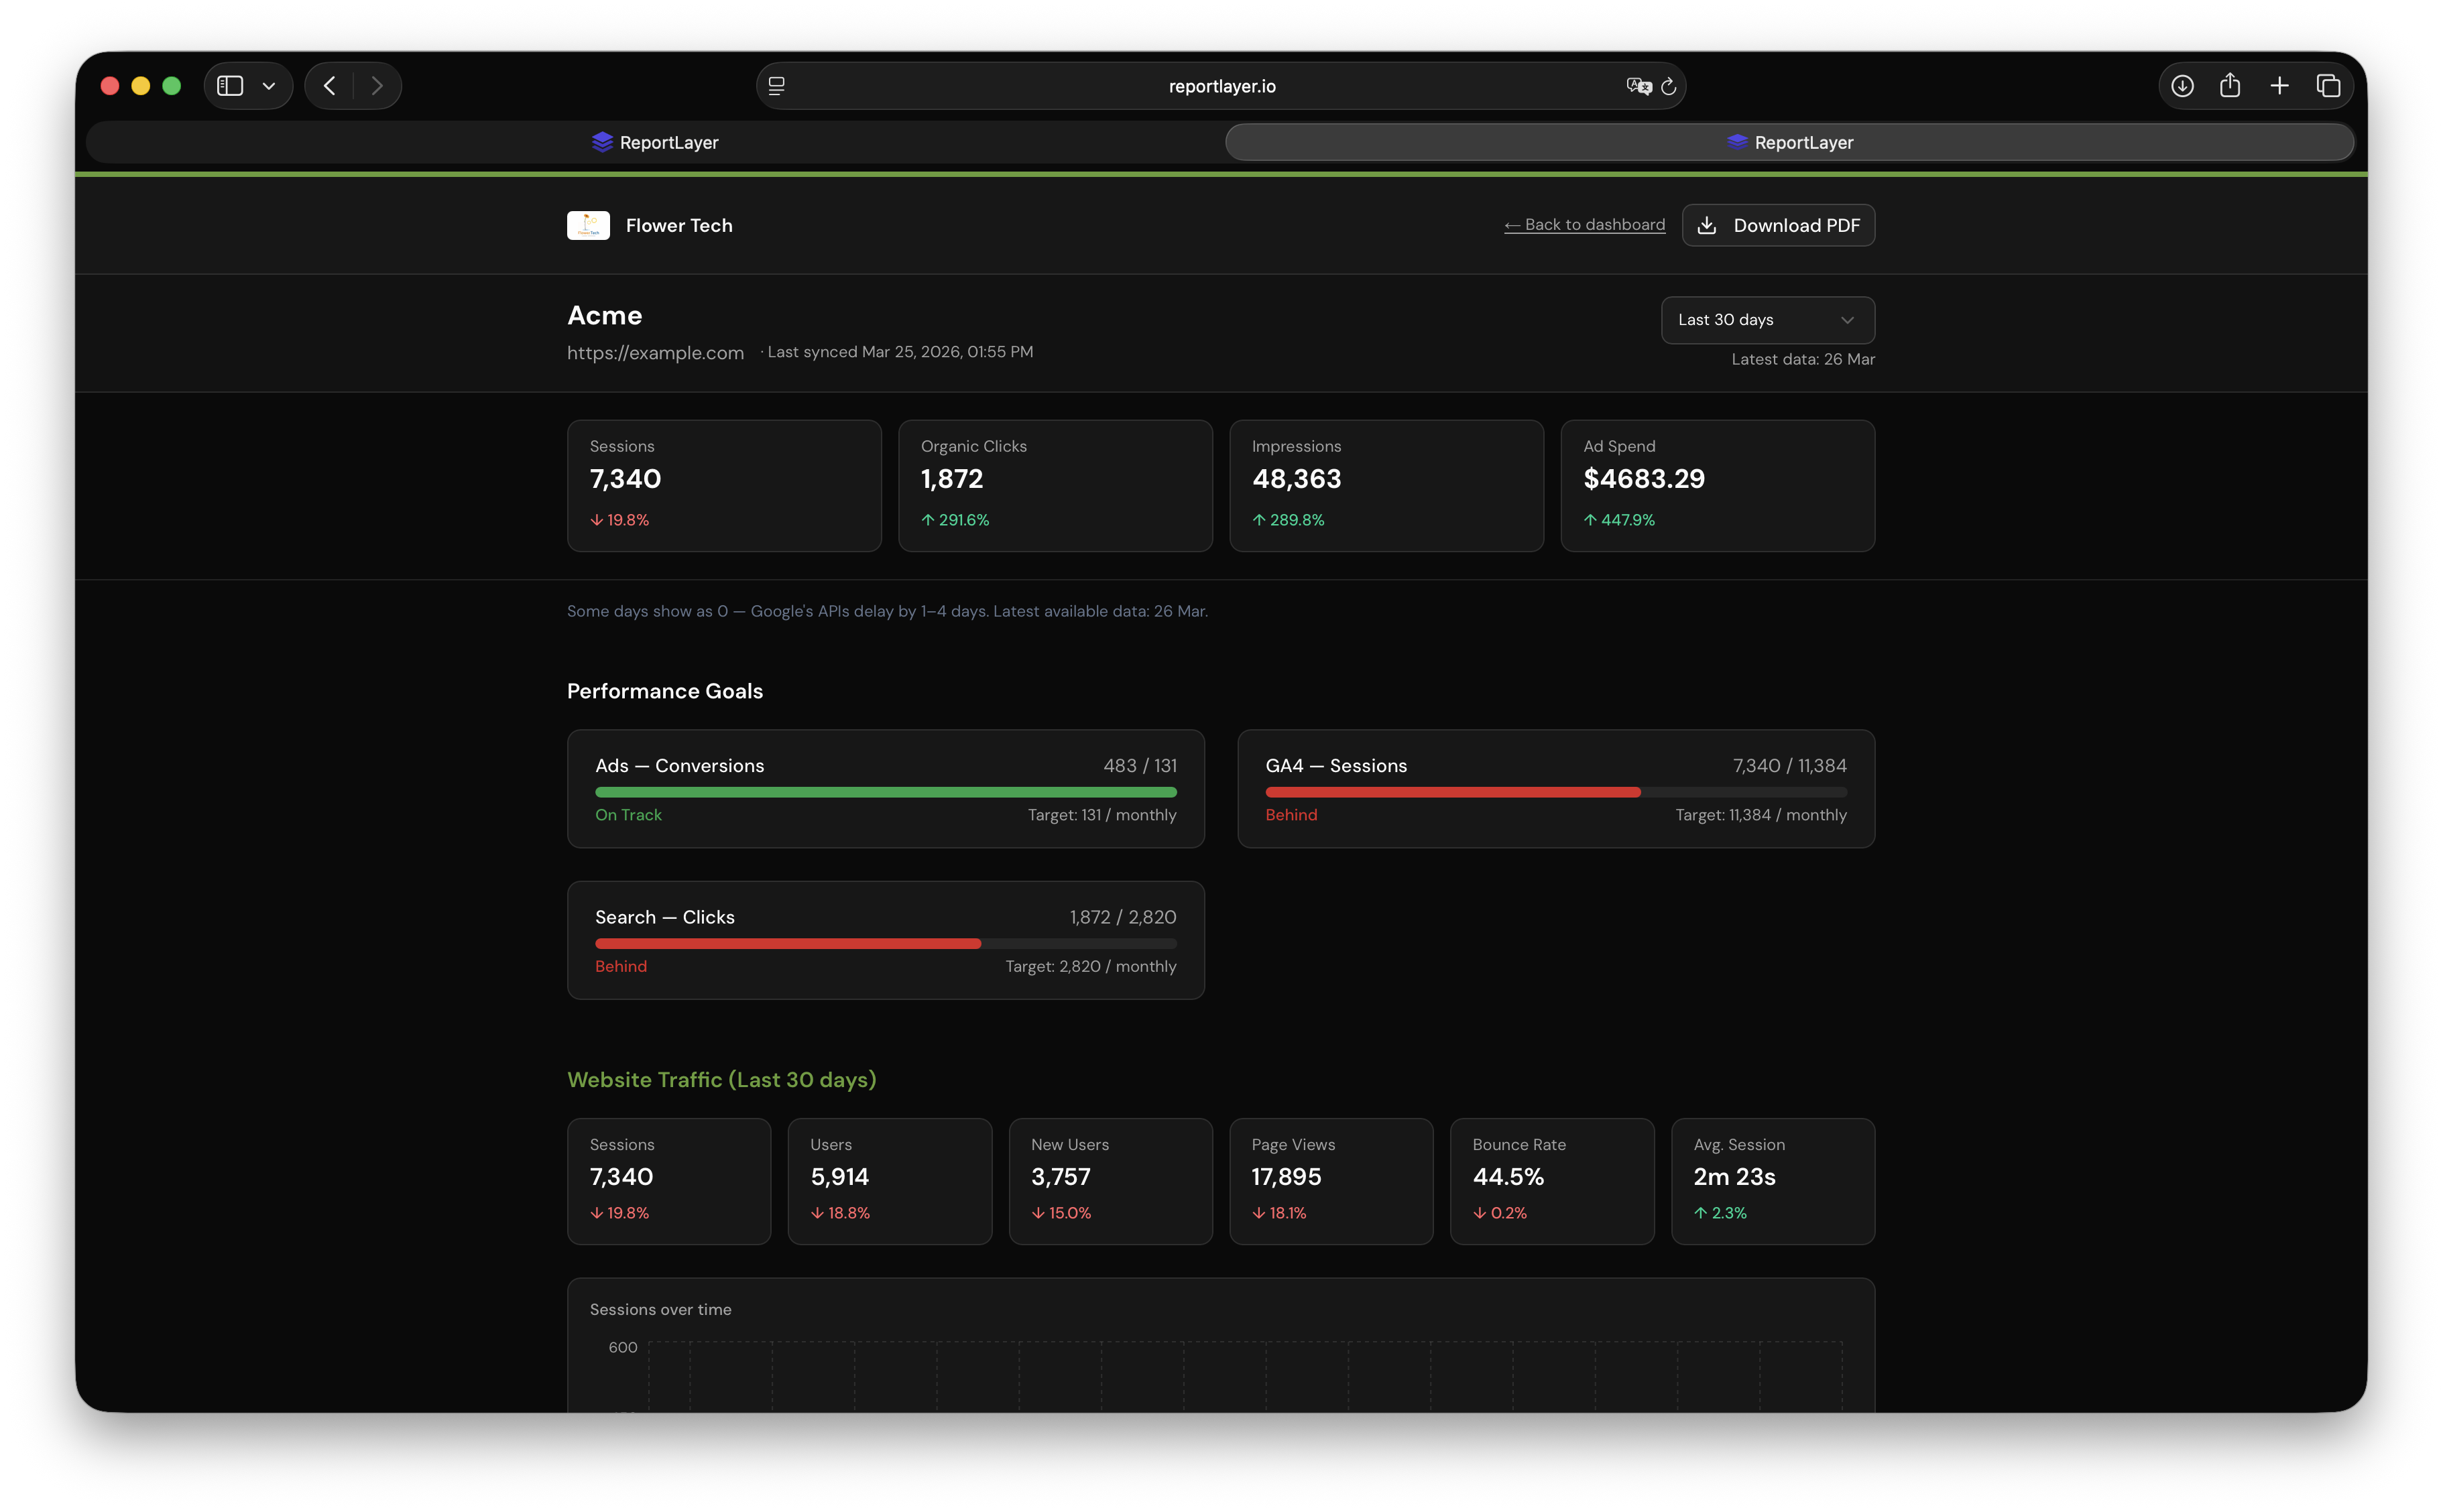
Tools like ReportLayer connect to GA4 via OAuth and pull the relevant metrics automatically. You configure which KPIs matter for each client, and the report generates itself with your agency logo and colors applied. No manual data pull, no export to a slide deck, no time spent on formatting. The report is always current because the data refreshes every 24 hours.
See a live demo report to get a sense of how GA4 metrics look in a client-ready format.
Frequently Asked Questions
Can I still access my Universal Analytics data?
Google shut down UA access in July 2024. Historical UA data is no longer accessible through the standard interface. If your agency exported historical data before the shutdown, you may have it in spreadsheets or a data warehouse. Otherwise, your GA4 data history starts from when you installed the GA4 property.
Why do GA4 sessions look lower than UA sessions did?
GA4 calculates sessions differently, particularly around session timeouts and campaign attribution. For most sites, GA4 reports 10 to 30 percent fewer sessions than UA did for the same traffic. This is a measurement difference, not a traffic decline.
Should I show clients engagement rate or bounce rate?
Show engagement rate. Bounce rate no longer exists as a standard metric in GA4. Engagement rate measures the percentage of sessions with meaningful activity, which is a more useful signal than the old single-page-view definition of a bounce.
How do I explain the numbers going down to a client?
Explain once, clearly, that the measurement methodology changed industry-wide when Google replaced UA with GA4. The numbers are not directly comparable across platforms. Focus the client on trend direction within GA4: is this month higher or lower than last month? That is the question that matters.
Which GA4 metrics matter most for SEO-focused clients?
For clients focused on organic search, pair GA4 traffic metrics with Google Search Console data: clicks, impressions, and average position. GA4 shows what happens after someone arrives from search. Search Console shows how well the site is performing in the search results themselves. Together, they give a complete picture of organic performance.
FREE GUIDE
5 Reporting Mistakes That Are Costing Your Agency Clients
The reporting errors that drive client churn, and how to fix them before your next monthly report.