Most agencies connect Google Search Console, pull clicks and impressions, and call it done. The client sees two numbers on a chart and nods along. That is a missed opportunity, because Search Console contains data that tells a much more specific story about how a site is performing in search, and most clients have never seen it explained in plain terms.
The agencies that get the most from Search Console are the ones who know which reports to pull beyond the summary view and how to translate that data into conversations clients actually care about. This guide covers what Search Console is really showing you, which reports most agencies ignore, and how to surface that data in client reports in a way that demonstrates genuine search expertise.
Beyond Clicks and Impressions
Clicks and impressions are the entry point, not the destination. They tell you how often the site appeared in search results and how often someone clicked. Useful for trend tracking. Not useful for explaining why performance is moving in a particular direction.
The more valuable signals live in the breakdowns. Segmenting by query, page, device, and country turns a summary number into an actionable picture of where the site is winning, where it is leaving traffic on the table, and where it is not showing up at all.
Query Data Your Clients Have Never Seen
The Queries report shows which search terms are driving impressions and clicks to the site. Most clients have never looked at this. They know they rank for certain terms in theory, but seeing the actual queries that generate real traffic is a different experience.
High-impression, low-click queries
Queries with hundreds or thousands of impressions but very few clicks are a specific and actionable finding. The site is showing up in results for those terms but the titles or meta descriptions are not compelling enough to earn the click. This is a content optimization opportunity that requires no new content: improving the existing page title and description for those queries can move clicks without any additional effort.
Frame this to clients as: “We are showing up for these searches, but not converting the visibility into visits. Here is what we are doing about it.” That is a concrete action tied to a specific data point.
Queries where position is close to page one
Any query with an average position between 11 and 20 is sitting at the top of page two in search results. These are the easiest wins in SEO: a small improvement in ranking moves the page from invisible to visible, and the traffic impact is disproportionate because click-through rates on page one are dramatically higher than page two.
Show clients a list of their near-page-one queries alongside the current average position and the estimated traffic improvement if they hit page one. This turns an abstract ranking number into a concrete business case for continued SEO investment.
Branded vs. non-branded query split
How much of a client's search traffic comes from people already looking for their brand versus people discovering them through non-branded terms? A site where 90 percent of clicks come from branded queries is heavily dependent on existing awareness. It is not growing its audience through search. Non-branded clicks represent reach, and growing non-branded traffic is typically the core of what agencies are hired to do.
Clients rarely know this split without being shown it. It is often a revealing data point that reframes the conversation about what search success actually looks like.
Page-Level Search Performance
The Pages report in Search Console shows which URLs are receiving the most search visibility and traffic. When read alongside GA4's top pages data, it tells you which pages are strong search performers and which are getting traffic from other channels.
Pages with impressions but zero clicks
If a page is appearing in search results but generating no clicks, it is either ranking for very low-volume queries, its title and description are not competitive with other results, or it is ranking so far down the results that impressions are technically being counted but no one realistically sees it. Each of these is a different problem with a different solution.
Surfacing these pages to clients creates a useful conversation. You are not just reporting clicks; you are explaining the gap between visibility and traffic and showing what levers can be pulled to close it.
Top-performing pages by clicks
The pages driving the most search traffic are usually the ones worth protecting first. If a page that drives 40 percent of organic clicks loses a few positions, the traffic impact is significant. Monitoring the top organic pages specifically and flagging any position drops is a service most agencies do not offer explicitly, but clients value enormously.
Device and Country Breakdowns
Search Console shows performance split by device (desktop, mobile, tablet) and by country. For most clients, mobile is the majority of search impressions even when desktop drives more conversions. Understanding where the mobile experience might be losing clicks is actionable: slow mobile load times, titles that truncate awkwardly on small screens, or structured data that displays better on desktop.
Country data matters for clients with geographic targeting. A client targeting the UK who is receiving significant impressions from the US for queries irrelevant to their business is seeing their Search Console data diluted by traffic they cannot convert. Identifying this helps explain why average position looks worse than expected for their core market.
Index Coverage and Technical Signals
The Coverage report in Search Console shows which pages are indexed, which have errors, and which are excluded and why. Most clients never look at this. Most agencies look at it only when something breaks. It should be part of a regular monitoring routine.
Pages with crawl errors
A crawl error means Google tried to index a page and encountered a problem, typically a 404 or a server error. If these pages previously had search traffic or backlinks, the crawl error is costing real organic visits. Catching and fixing crawl errors before they accumulate is part of a proactive technical SEO practice that clients often do not realize is being done on their behalf. Making it visible in the report gives it the credit it deserves.
Pages excluded by noindex
Occasionally a page is excluded from indexing by a noindex tag that should not be there: a development setting that carried over to production, a plugin that added directives to pages that should rank. A regular check of the excluded pages list catches these before they cause long-term ranking damage.
How to Include Search Console Data in Client Reports
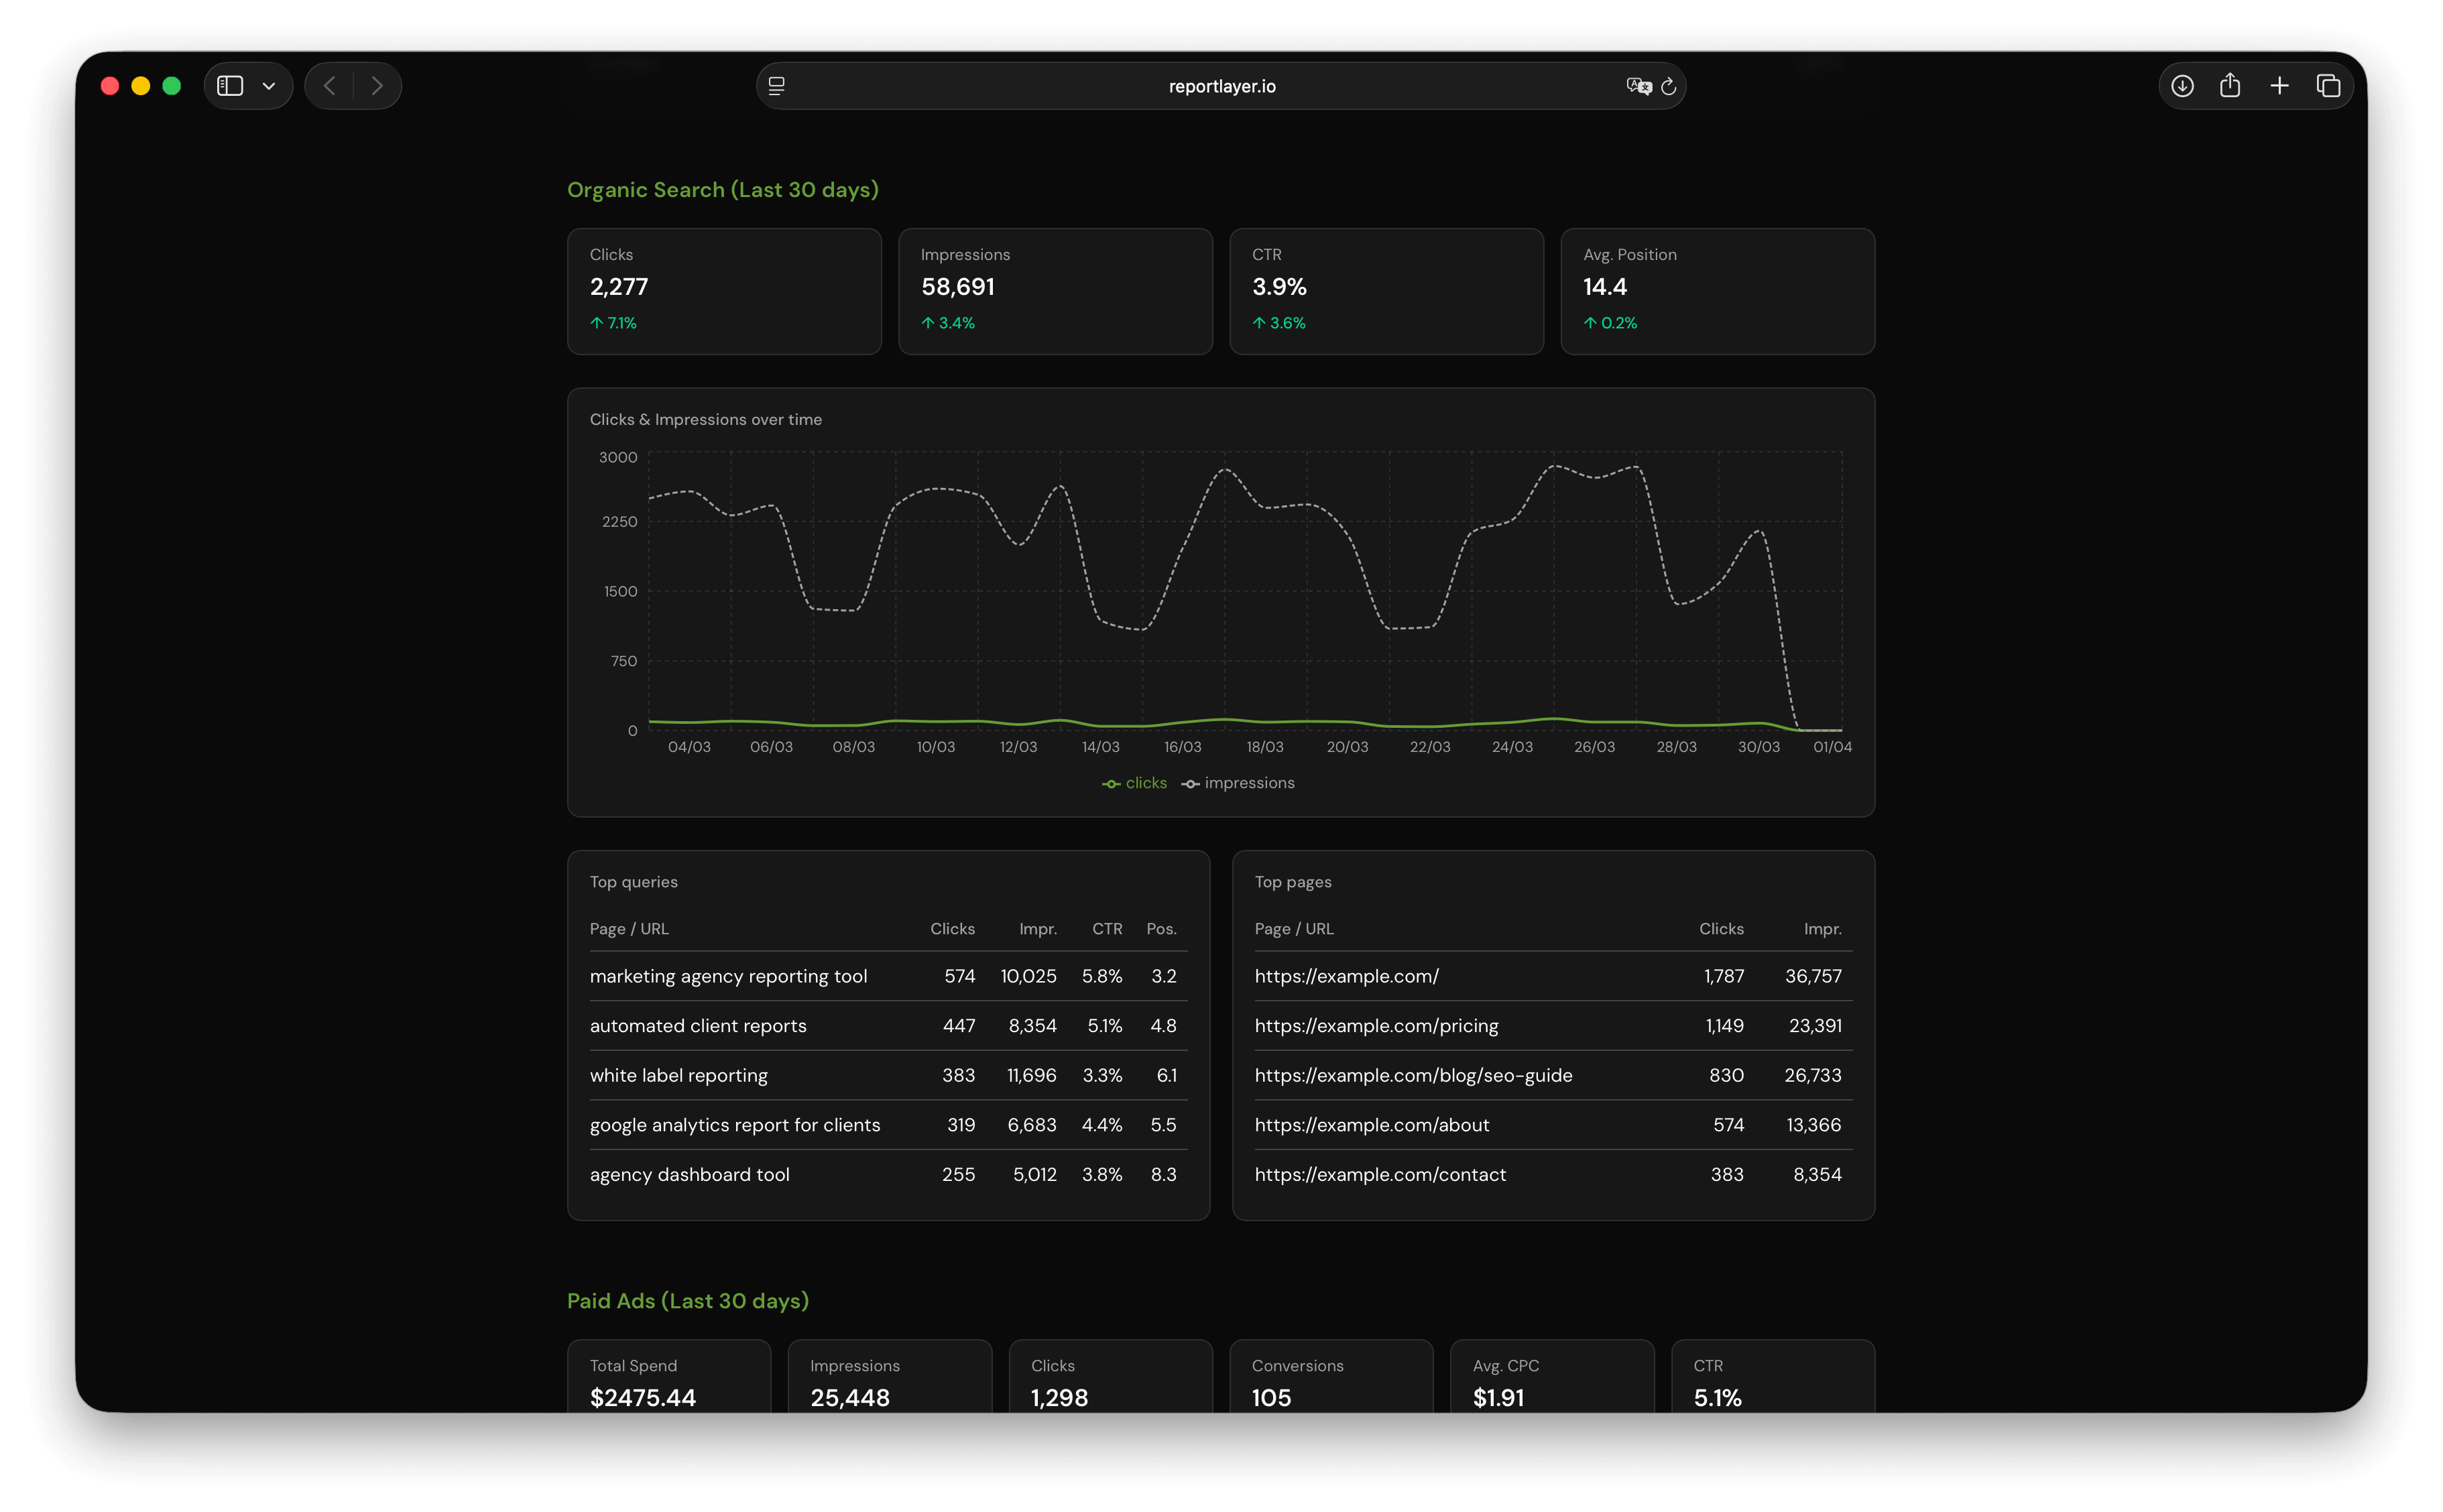
Not all of this data belongs in every client report. The goal is to include what is actionable and relevant, not to dump the entire Search Console UI into a PDF.
A practical approach: include clicks, impressions, and average position as core metrics in every report. Add a rotating spotlight section that highlights one specific finding this month: the top near-page-one queries, a newly discovered branded/non-branded split, or a coverage issue that was identified and resolved. This gives clients something specific to discuss beyond the summary numbers and positions your team as actively engaged with the data rather than passively reporting it.
Tools like ReportLayer pull Search Console data automatically via OAuth and display clicks, impressions, and average position alongside GA4 traffic metrics in a single branded report. This removes the manual export step and keeps the data consistent from month to month. See a live demo to get a sense of how Search Console and GA4 data look side by side in a client-facing format.
Frequently Asked Questions
How current is the data in Google Search Console?
Search Console data is typically 2 to 3 days behind. It is not real-time like some GA4 reports. The last 3 months of data are the most reliable for trend analysis. Data older than 16 months is dropped from the interface, so if you need historical records, export them regularly.
Does Google Search Console show keyword rankings?
Not in the traditional sense. It shows average position for queries that generated at least one impression, which is a proxy for ranking. Average position is calculated across all queries and all ranking positions, so a single query might rank 3rd sometimes and 8th other times, and the average will show something in between. For precise position tracking, a dedicated rank tracker is more accurate. But for trend direction, Search Console average position is sufficient for most client conversations.
Should I share raw Search Console access with clients?
It depends on the client. Technically sophisticated clients sometimes want direct access, and there is no reason to withhold it. For most clients, raw Search Console access creates more confusion than clarity. A curated report showing the relevant metrics in plain language is more useful than a login to an interface they are not equipped to interpret.
How do I explain average position to a client?
Tell them it represents the average rank of their pages in search results for the queries shown. Position 1 means they appear at the very top. Position 10 means they appear at the bottom of page one. Position 20 means they are at the top of page two, which most people never reach. Keep it concrete: lower is better, and moving from 15 to 8 is a meaningful win.
What is a good click-through rate from Search Console?
It varies significantly by position, query type, and industry. Position 1 results typically see click-through rates between 20 and 40 percent. Position 5 averages around 6 to 8 percent. Position 10 is roughly 2 to 3 percent. If a client is getting a lower click-through rate than these benchmarks for their position, the title and meta description are worth reviewing. If they are getting higher, that is a signal worth celebrating.
FREE GUIDE
5 Reporting Mistakes That Are Costing Your Agency Clients
The reporting errors that drive client churn, and how to fix them before your next monthly report.