Google Ads generates more data than almost any other marketing channel. Impression share, quality scores, search term reports, auction insights, bid strategy performance, conversion lag, assisted conversions. The platform is built for analysts, not for the business owner who checks their report once a month and needs to know if the ads are working.
The skill in Ads reporting is knowing which metrics to show and which ones to handle internally. A client who understands their cost per conversion and whether it is improving has what they need. A client who is staring at impression share percentages and average position scores is lost, and a lost client is a client who starts second-guessing the work.
This guide covers which Google Ads metrics belong in client reports, which ones your team should use internally without surfacing to clients, and how to frame Ads performance in a way that generates confidence rather than confusion.
What to Show Clients
The metrics clients need in an Ads report are the ones tied directly to business outcomes. Traffic, cost, conversions, and efficiency. Everything else is operational detail that supports your optimization work but does not belong in a client-facing summary. These align with the seven metrics every monthly client report should include , the framework for keeping reports useful without overwhelming clients.
Clicks and click-through rate
Clicks show how many people took the step from seeing the ad to visiting the site. Click-through rate (CTR) shows how well the ad copy and targeting is generating interest. A rising CTR with stable or growing click volume is a clear signal that ad copy is working. A falling CTR alongside stable impressions means the ads are being shown but not resonating. Both are understandable in plain language.
Spend against budget
Every client wants to know how much was spent and whether it matched the agreed budget. Show the actual spend for the period alongside the budget. If spend came in under budget, explain why (low search volume, budget pacing, intentional underspend based on performance). If spend exceeded budget, explain that immediately, before the client sees the number without context.
Conversions and cost per conversion
This is the metric most clients care about most: how many conversions did the ads generate and what did each one cost? Define what counts as a conversion for this client specifically and include that definition in the first report, then reference it consistently. A form fill is different from a purchase is different from a phone call. Clients need to know which type of conversion they are seeing.
Cost per conversion is the efficiency metric. Show it with a period-over-period comparison. If it is improving (lower cost per conversion), that is a clear win. If it is worsening, explain the context: increased competition, seasonality, a new campaign still in the learning phase.
Return on ad spend (if applicable)
For e-commerce clients with conversion values tracked in Google Ads, return on ad spend (ROAS) is the headline metric. A client spending €5,000 on ads and generating €25,000 in tracked revenue has a 5x ROAS. Show it, trend it over time, and make sure the client understands what revenue is being counted (typically last-click attributed transactions tracked via the pixel).
For service businesses where conversions are leads rather than transactions, ROAS does not apply. Stick to cost per conversion and let the client apply their own close rate and deal value to assess ROI.
Period-over-period comparison on every metric
Every metric in the Ads report should be shown alongside the previous period. This month vs. last month, or this quarter vs. the same quarter last year for seasonal businesses. A number without a comparison is just a data point. A comparison tells the client whether things are moving in the right direction.
What to Handle Internally
These metrics are essential for your team to run effective campaigns. They are not useful in a client-facing report and often create more questions than they answer.
Quality scores
Quality score is a diagnostic tool for Google Ads practitioners. It reflects the relevance of keywords, ads, and landing pages relative to each other and to the searcher. Clients who see a quality score of 4 out of 10 hear that something is failing, even when a 4 might be acceptable for a highly competitive term where no advertiser gets a 10. Leave this in your internal optimization work. Summary: you are optimizing quality scores continuously; the client sees the result in cost per click, not the score itself.
Search impression share
Impression share shows how often ads appeared compared to how often they were eligible to appear. Useful for identifying budget constraints and competitive positioning. Not useful for a client overview because it requires significant context to interpret. A 40 percent impression share is not inherently bad, but a client seeing it without context will assume 60 percent of potential was missed.
Auction insights
Auction insights compares your client's performance to competitors bidding on the same auctions. Extremely useful for understanding the competitive landscape. Include it in your internal review and reference it in strategic recommendations. Do not paste a table of competitor domains and overlap rates into a client report without substantial framing: it prompts questions about competitors that distract from the performance conversation you want to have.
Average CPC at the keyword level
Average cost per click varies by keyword, match type, and device. Showing clients keyword-level CPC data without context leads to questions about why one keyword costs more than another, which opens a long conversation about auction dynamics, quality scores, and competitor behavior. Surface overall average CPC for the campaign as a single figure if it is relevant. Leave keyword-level detail in your internal reports.
Campaign structure details
How many ad groups you have, how many keywords, which match types are active: these are operational details. They matter for account management. They do not belong in a performance report. The client hired you to manage these decisions. Reviewing them in the report signals insecurity about the choices rather than expertise.
How to Explain Ads Performance in Plain Language
The monthly Ads section of a client report should answer three questions: what was spent, what did it produce, and is it getting more or less efficient over time?
A format that works well: start with spend vs. budget, move to clicks and conversions, then cost per conversion compared to the previous period. Add two to three sentences of context: what changed this month, what you optimized, and what to expect next month. That is a complete Ads report for a client who is not a paid search specialist.
When performance dipped for a reason outside your control (increased competition, a Google Ads policy change, higher seasonal CPCs), say so. Clients who receive an explanation for a dip are far more accepting of it than clients who see a worse cost per conversion with no comment. Transparency on the bad months builds more trust than only reporting on the good ones.
Setting and Reporting Against Ads Goals
Every Ads client should have a documented cost-per-conversion target, established at the start of the engagement. Reporting cost per conversion without a target is less useful than it sounds: is 45 euros per lead good or bad? The client cannot tell without a benchmark.
Set the target based on the client's business model. A client with a 2,000-euro average deal value and a 30 percent close rate can afford a cost per lead of around 200 euros to maintain a positive ROI. A client with a 200-euro product has a much tighter ceiling. Make the math explicit, agree on the target, and track against it from the first report.
Automating Google Ads Reporting
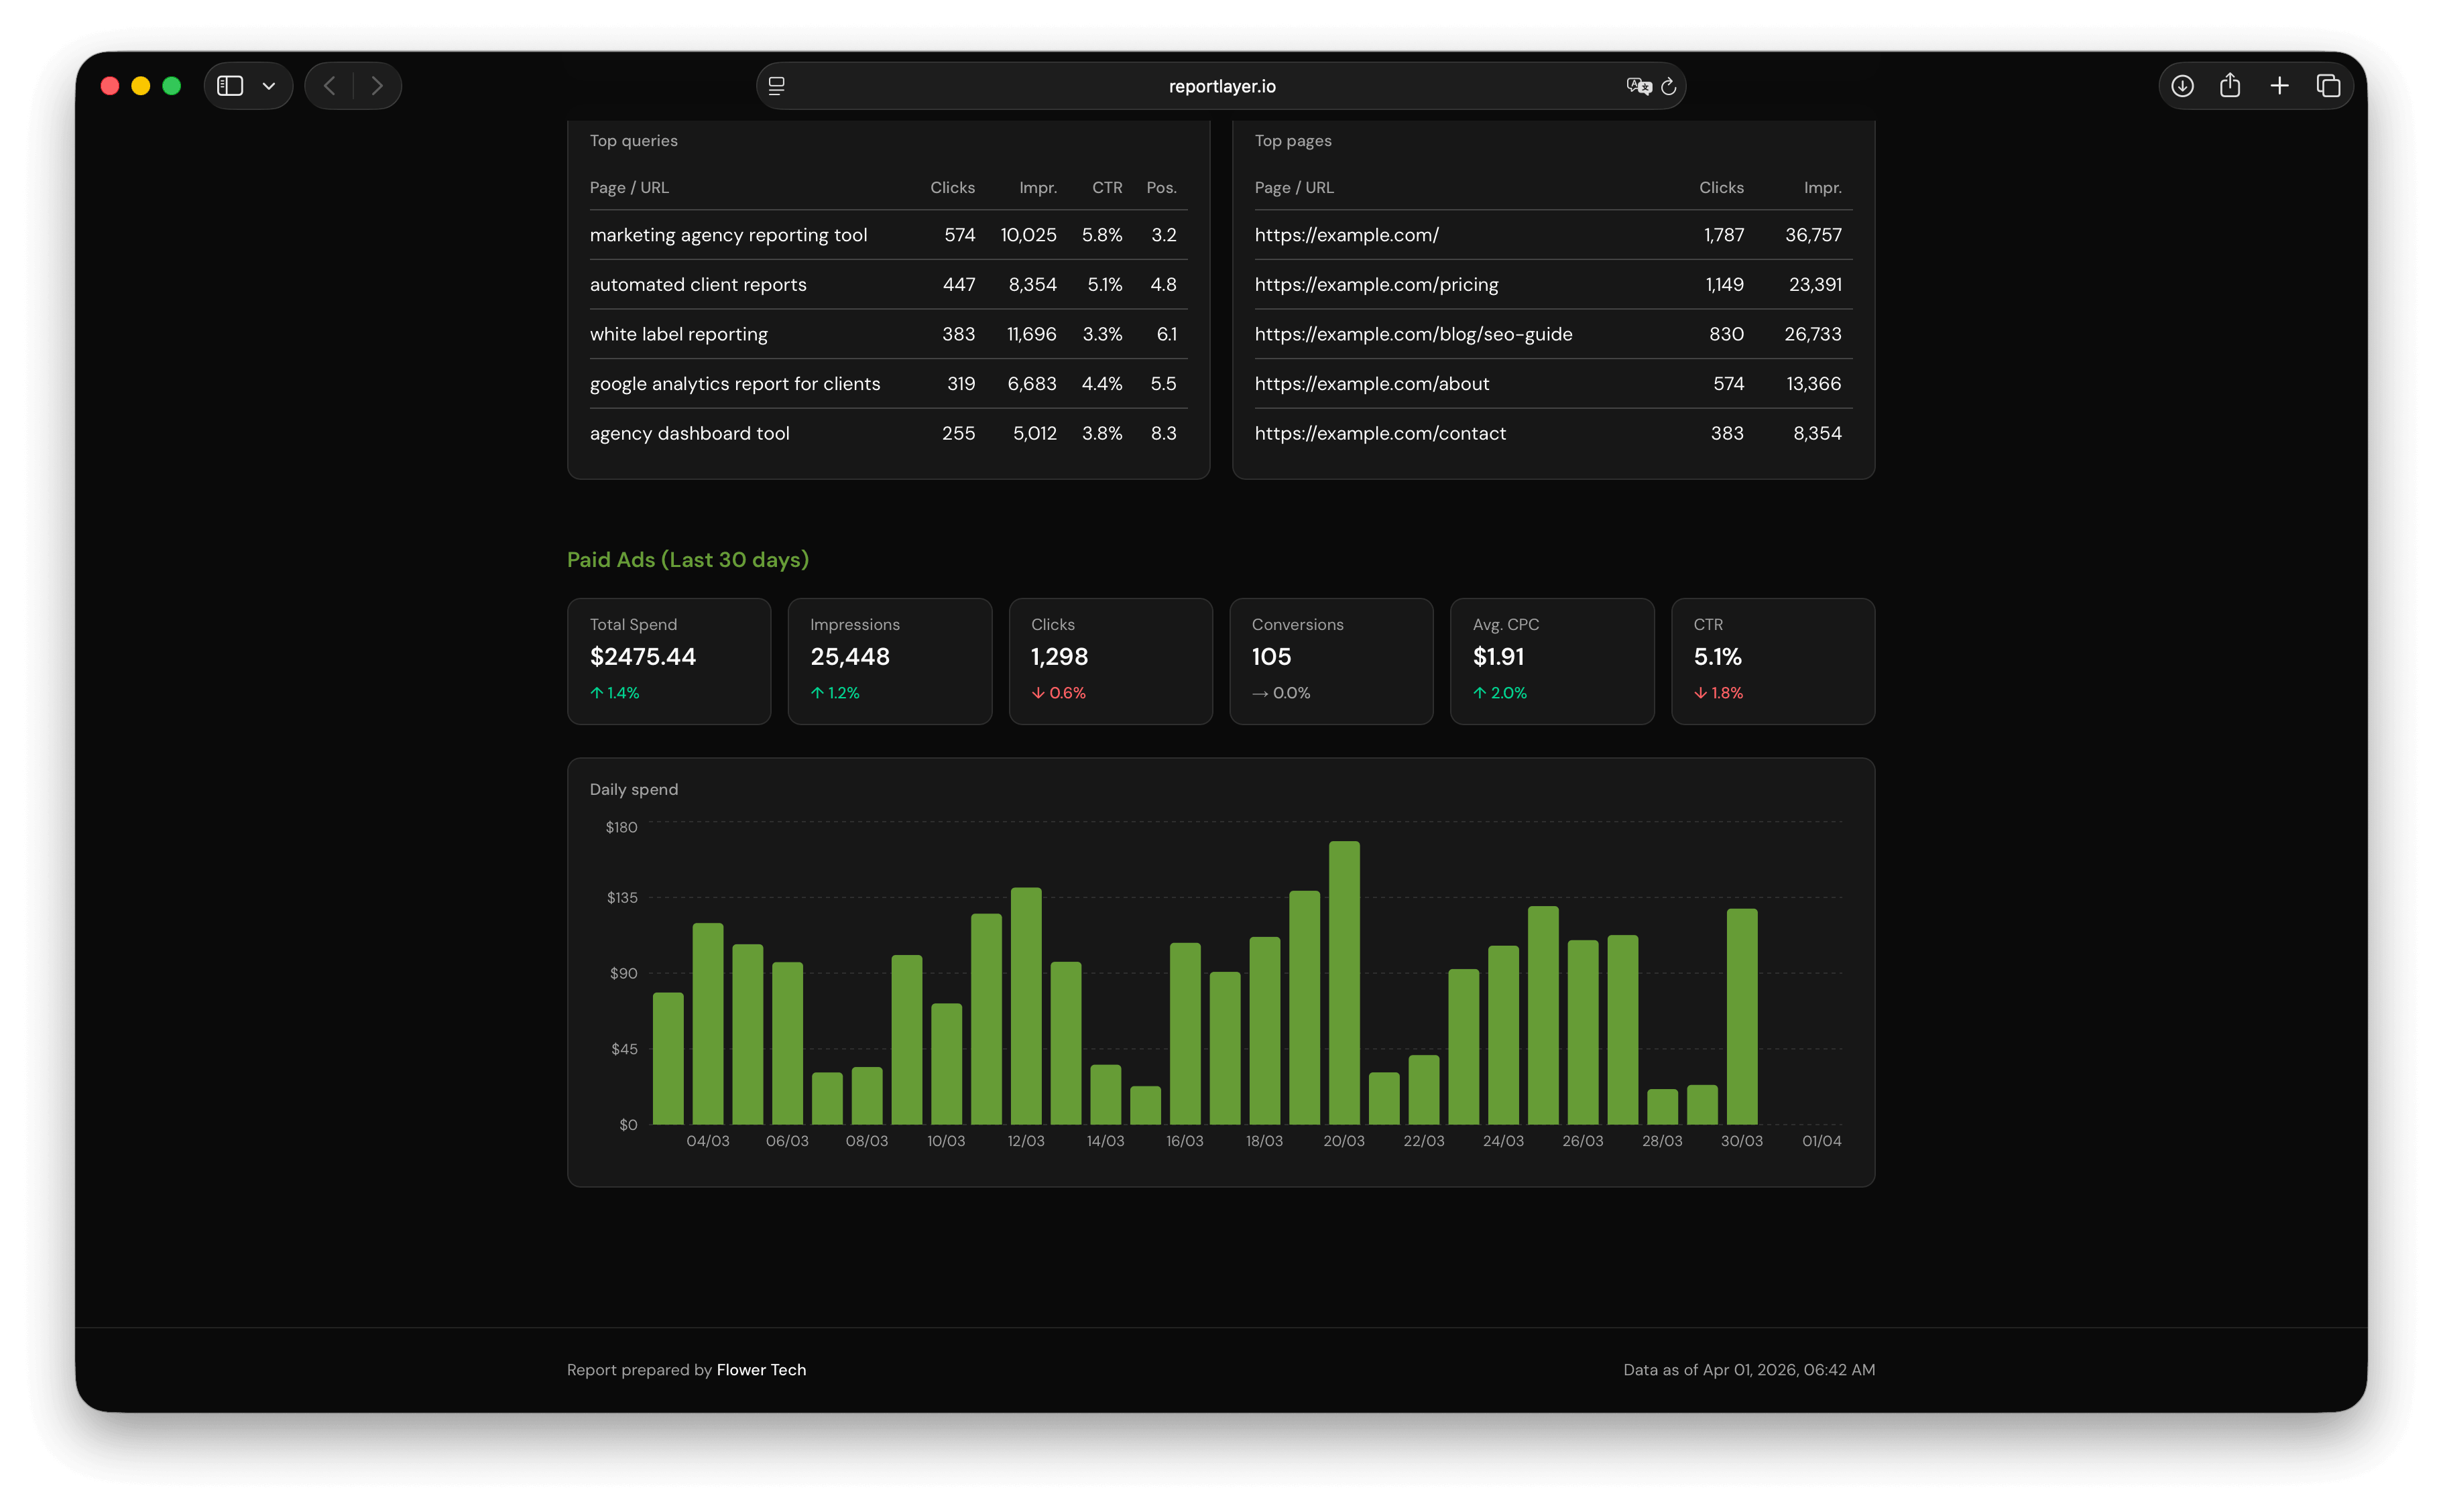
Pulling Google Ads data manually each month creates the same problems as any manual reporting process: it takes time, it introduces the risk of copying numbers incorrectly, and it means the report is always slightly out of date. Automating the data pull removes all three problems.
ReportLayer connects to Google Ads via OAuth and pulls spend, clicks, and conversion data automatically. Alongside GA4 and Search Console data in the same report, it gives clients a complete picture of their digital performance without requiring manual exports from three separate platforms. Each report refreshes automatically and carries your agency branding throughout. View a live demo report to see how Ads, GA4, and Search Console data look together in a single client view.
Frequently Asked Questions
Should I show Google Ads and organic data in the same report?
Yes. Clients who are running both paid and organic programs benefit from seeing them in the same report: the paid channel drives traffic while organic is building, or organic covers terms that are too expensive to bid on. Showing them separately creates a siloed view that does not reflect how the channels interact in practice.
How do I handle a month with significantly worsened cost per conversion?
Report it directly and include the explanation. Common causes: increased competition in the auction, a Google Ads policy change that affected targeting, a landing page issue on the client side, or a campaign in a post-optimization learning phase. Identify which applies, explain it clearly, and include what steps are being taken. Never omit a bad metric and hope the client does not notice.
What if a client asks to see keyword-level performance?
Offer to walk through it on a call rather than including a keyword table in the standard report. Keyword-level data is useful in context but confusing as a static table. If a client consistently wants keyword-level detail, add a separate technical appendix to the report that they can choose to read or ignore.
How do I report on conversion tracking if there are attribution gaps?
Note the limitation explicitly. If phone call conversions are not being tracked, say so and indicate what you are doing to address it. If some conversions are being undercounted due to iOS privacy changes, include a brief explanation. Clients who understand the data limitations trust the numbers they do receive more than clients who are later surprised by an unexplained gap.
Is it worth showing impression data at all?
Total impressions can be useful as context alongside clicks: a high impression count with a low CTR indicates an ad copy or targeting issue. Include impressions as a secondary figure if it adds to the story. Do not include it as a headline metric. Most clients have no reference point for what their impression volume should be.
FREE GUIDE
5 Reporting Mistakes That Are Costing Your Agency Clients
The reporting errors that drive client churn, and how to fix them before your next monthly report.