Most agency reports include too much. A wall of numbers from GA4, a screenshot from Search Console, a table from Ads, and a summary paragraph that says things are trending in the right direction. Clients read the summary and ignore the rest, if they open the report at all.
The goal of a monthly client report is not to prove you have access to data. It is to give the client a clear picture of whether their investment is working. That requires discipline: knowing which metrics to include, which to leave out, and how to present each one so a non-analyst can understand it without a call to explain it.
Here are the seven metrics every agency should include in a monthly client report, plus what to cut and how to frame each one.
1. Sessions (with Period-Over-Period Change)
Sessions is still the clearest indicator of overall website traffic. Clients understand it, it benchmarks cleanly over time, and it serves as the anchor metric against which everything else is measured.
Show it with a comparison: sessions this month vs. sessions last month, or this month vs. the same month last year. A number without a comparison is just a number. A number with a direction tells a story.
One note for clients still adjusting to GA4: sessions in GA4 typically run 10 to 30 percent lower than they did in Universal Analytics due to methodology differences. Set this expectation early, in writing, so it does not become a recurring question. Our GA4 vs Universal Analytics guide has language you can copy directly into the first report after migration.
2. Organic Clicks from Search Console
GA4 sessions show you total traffic. Google Search Console clicks show you specifically how many people arrived from organic search. For any client doing SEO work, this is the metric they care about most, because it is the direct output of the work you are doing.
Show clicks alongside impressions. Impressions tell you how often the site appeared in search results. Clicks tell you how often people chose to visit. The ratio between them is the click-through rate, which is worth tracking separately as a signal of title and meta description quality.
If average position is relevant for the client, include it as a secondary figure. A rising position (lower number) alongside flat clicks can mean the site is ranking better but the titles need work. That is a useful conversation to have. For a deeper look at what Search Console is really showing you beyond the summary numbers, see how to use Search Console data in client reports.
3. Engagement Rate
GA4 replaced bounce rate with engagement rate. Where bounce rate measured the percentage of sessions with no interaction, engagement rate measures the percentage of sessions with meaningful activity: at least 10 seconds on site, two or more pages viewed, or a conversion event triggered.
For most clients, engagement rate is a proxy for content quality and relevance. If a client is spending on paid ads or producing new content, engagement rate shows whether what they are driving traffic to is actually resonating.
A good benchmark for most sites is 55 to 70 percent. Below 50 percent generally warrants investigation. Above 70 percent is a strong signal that the right audience is arriving on the right pages.
4. Traffic Sources Breakdown
Clients want to know where their visitors are coming from. The channel breakdown: organic, direct, referral, social, paid, and email gives them that picture. More importantly, it helps you connect your work to the results. If you are running social campaigns, the social channel should be moving. If you are doing SEO, organic should be climbing.
Keep this section simple. A clean bar chart or table with channel names and session counts is enough. Adding percentage of total traffic per channel helps clients understand the relative weight of each source.
Avoid showing raw UTM breakdowns or medium/source combinations unless the client specifically asked for that level of detail. It adds noise without adding insight for most report readers.
5. Top Pages by Views
A list of the top 5 to 10 pages by views tells clients which content is working. It surfaces where their audience spends time, which pages drive the most traffic, and which recent content published during the period is getting traction.
This section consistently gets more client attention than almost any other part of the report. Clients recognize their own page titles. They have opinions about which pages should be performing well. Showing the top pages invites productive conversation about content strategy.
If the client has specific landing pages tied to campaigns or goals, call those out explicitly even if they do not appear in the top 10. Context around the pages the client cares about matters more than a generic ranking.
6. New Users vs. Returning Users
The split between new and returning users tells a story about audience development. A site that is 90 percent new users is reaching people for the first time consistently, which is good for growth but may indicate a retention problem if the product or content should be bringing people back. A site that is 80 percent returning users has a loyal audience but may not be growing.
There is no universal right ratio. The right balance depends on the business model. An e-commerce store wants both: new acquisition and repeat purchases. A news site expects high returning rates. A lead-generation site mostly cares about new visitors entering the funnel.
Show this metric with context tied to the client's goals. Include a one-sentence note explaining what the split means for their specific situation. This prevents clients from fixating on the number without understanding what to do with it.
7. Goal Progress Against Targets
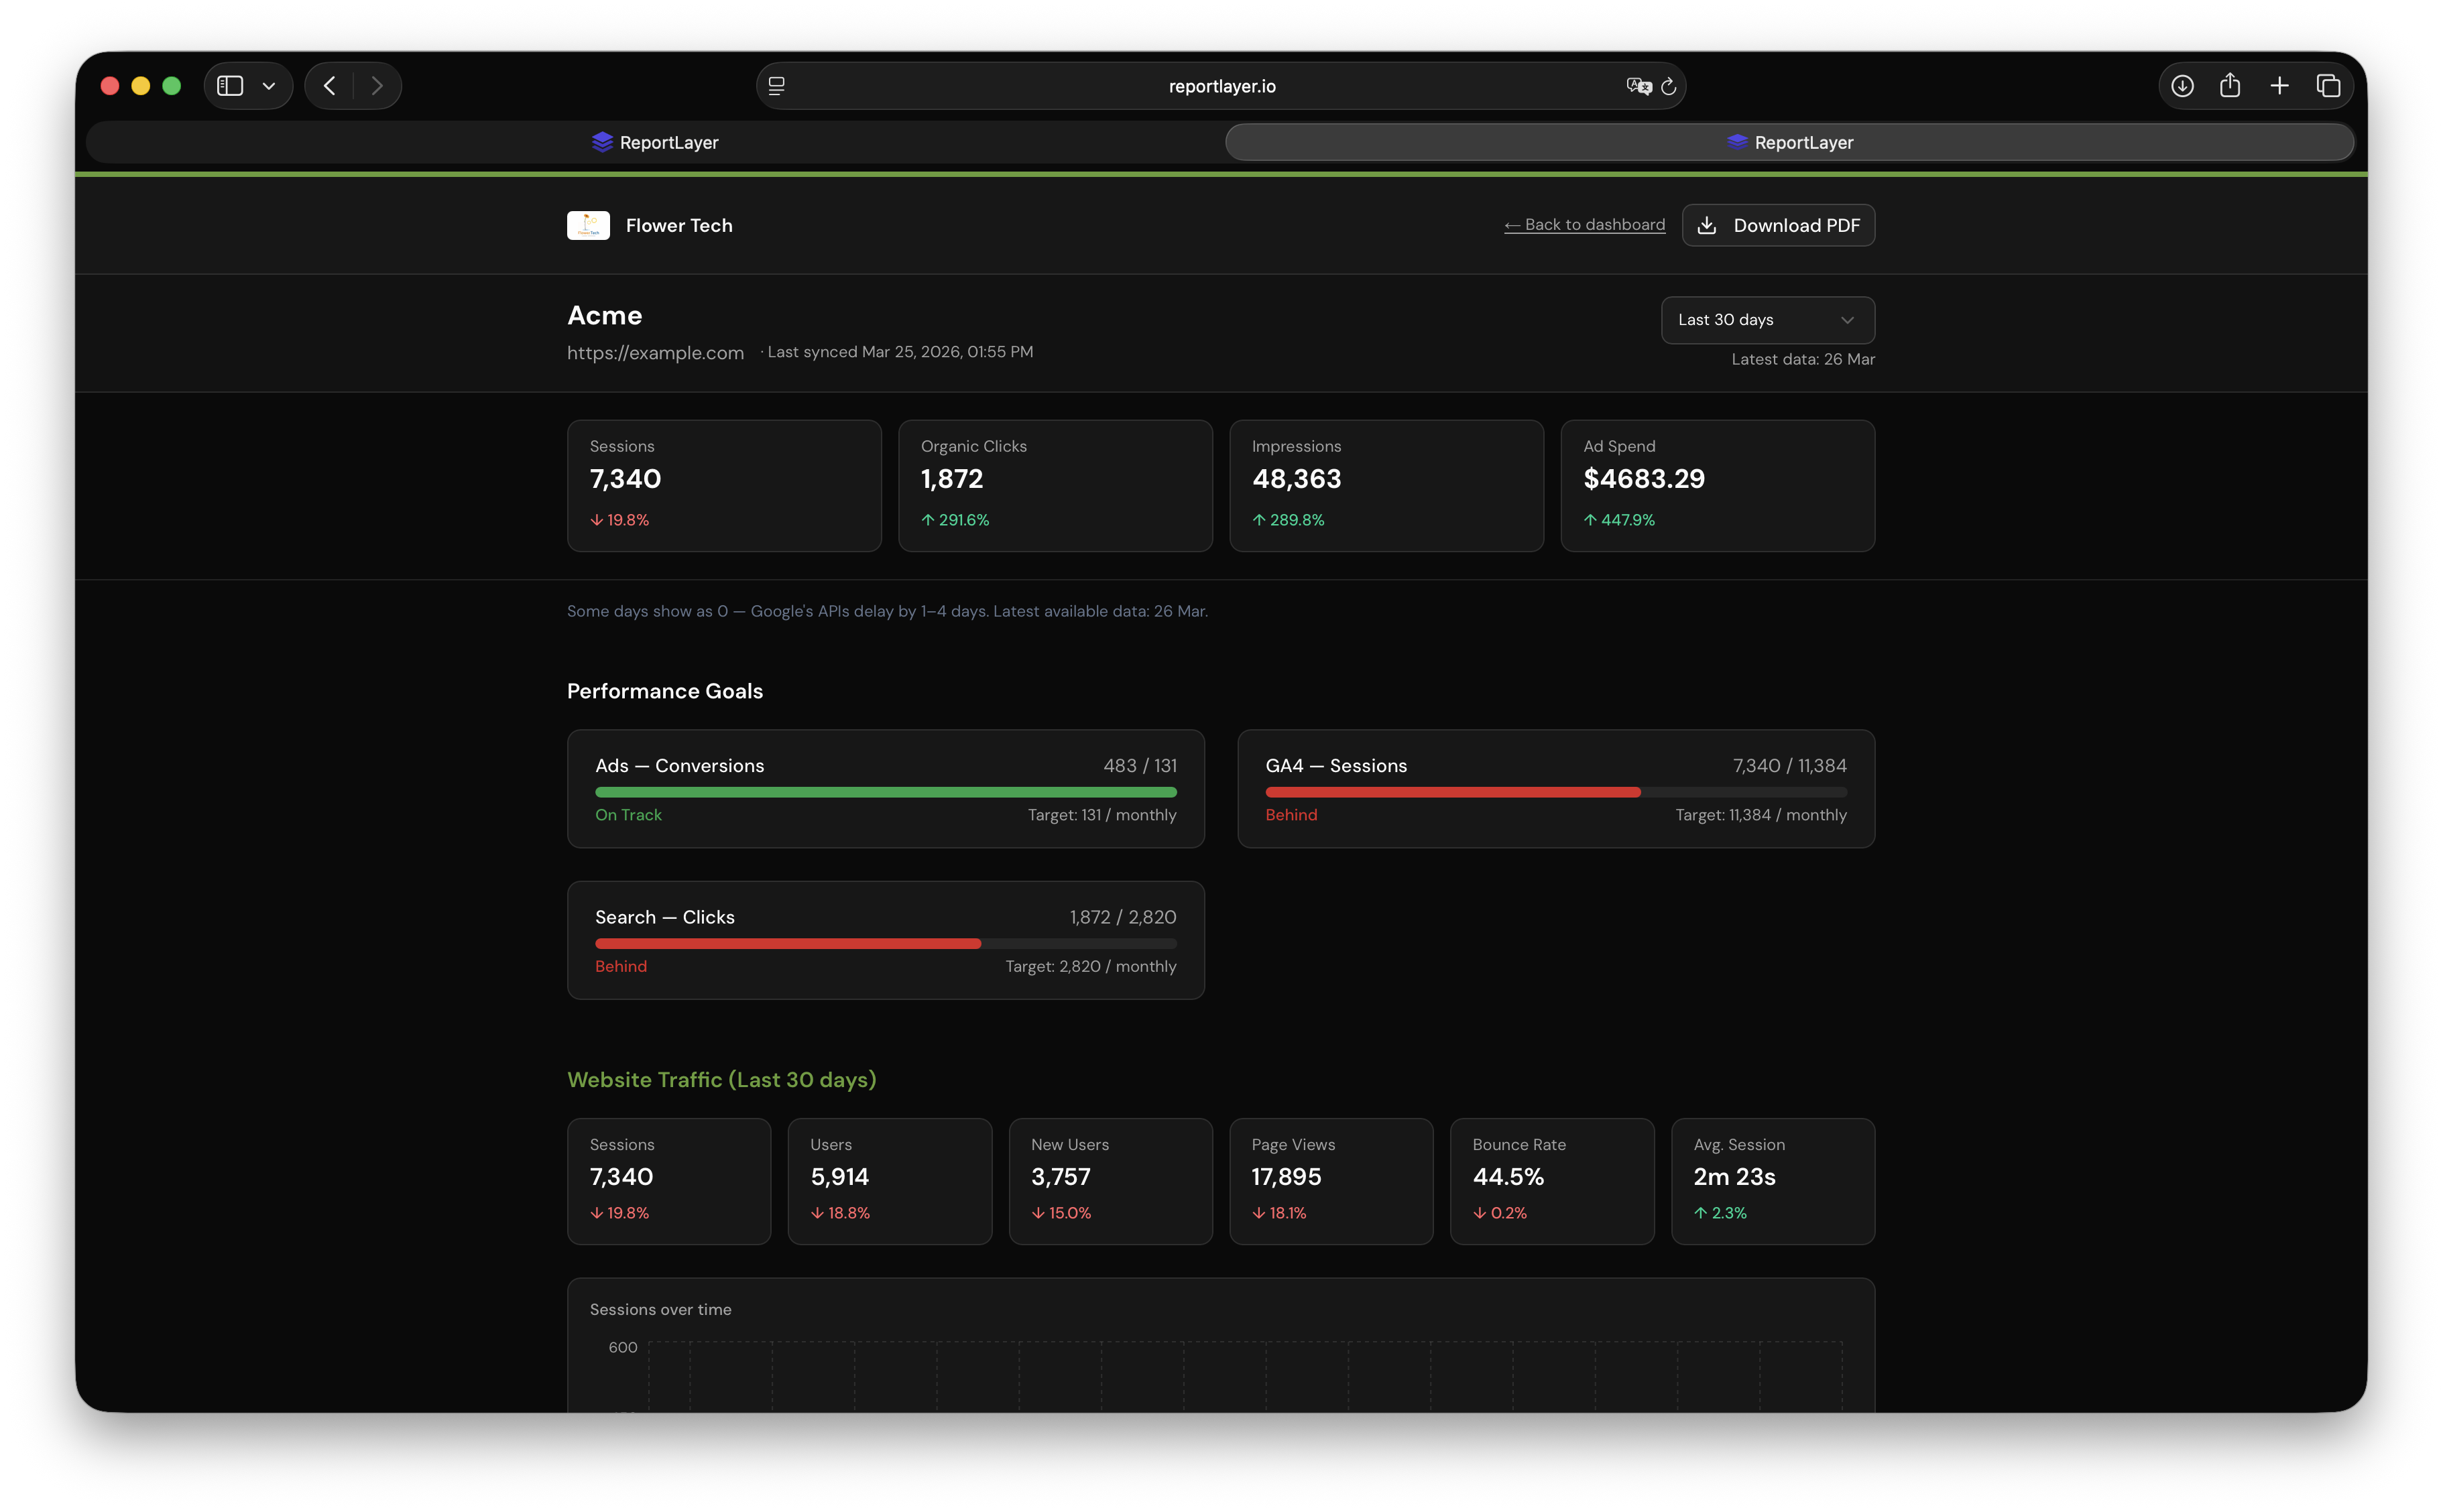
Every metric in a client report is more meaningful when measured against a target. If the client set a goal of 500 organic clicks per month, show how this month compares. If they are tracking toward 1,000 sessions, show a progress bar. Numbers against targets turn a status report into an accountability document.
KPI targets also give you a natural structure for client conversations. Instead of reviewing a list of numbers, you are reviewing performance against agreed goals. That reframes the reporting relationship from information delivery to joint accountability.
If you do not currently have documented goals for each client, this is worth fixing before the next report cycle. Even rough targets (more sessions than last month, organic clicks growing by 10 percent quarter over quarter) give the report a direction.
What to Leave Out of Monthly Reports
Knowing what to include is half the job. Knowing what to cut is the other half.
- Average session duration: Clients interpret short durations as bad news even when context matters (a client reads the headline, gets the answer, leaves). Unless time-on-site is a specific goal, cut it.
- Pages per session: Similar issue. Low pages per session on a single-page site or a site where users call after reading one page looks bad but is not. Save this for sites where deeper exploration is a clear goal.
- Raw event counts from GA4: GA4 tracks dozens of events automatically. Scroll depth, file downloads, outbound clicks. Most of these have no relevance to a client overview. Surface only events that tie to conversion goals.
- Device breakdown for clients who do not care: Device data is useful when a client is planning a mobile redesign or has noticed issues on a specific device. Otherwise, it is filler.
- Any metric you cannot explain in one sentence: If you have to spend five minutes explaining why a metric is in the report, it probably should not be in the report.
How to Format These Metrics for Non-Analysts
The same seven metrics can be presented in a way that generates questions or in a way that generates confidence. The difference is usually formatting and framing.
Show numbers with direction indicators: up arrows, down arrows, or percentage changes in a consistent color scheme. Green for improvement, red for decline, grey for flat. Clients scan for color before they read numbers. Give them a visual signal that tells them whether to feel good or concerned before they read anything.
Group related metrics together. Sessions and engagement rate belong near each other. Organic clicks and average position belong together. Traffic sources should be its own section. Breaking the report into clear blocks helps clients navigate without needing to read sequentially from top to bottom.
Putting It Together in an Automated Report
Once you know which metrics to include, the next step is removing the manual work of assembling them every month. Pulling data from GA4, Search Console, and Ads, formatting it consistently, and sending it to each client takes time that compounds across 10, 20, or 30 clients.
Tools like ReportLayer pull these exact metrics automatically from GA4 and Search Console via OAuth, apply your agency branding, and deliver the report on a schedule you set per client. You configure the KPI goals once, and every subsequent report shows progress against those targets automatically. No monthly assembly required. For guidance on which Ads metrics to include alongside these, see Google Ads reporting for agencies.
View a live demo report to see how these seven metrics look in practice.
Frequently Asked Questions
How many metrics should a monthly client report include?
Seven to ten is the right range for most clients. Fewer than five and the report feels thin. More than ten and clients start skimming. The goal is a report the client can read and understand in five minutes without needing a follow-up call.
Should I include the same metrics for every client?
The core seven can apply to almost any client with a website. Adjust based on their goals: an e-commerce client needs transaction data, an SEO-focused client needs position data, a paid ads client needs cost and conversion data alongside organic metrics. Start with the core seven and layer in what is specific to their work.
How do I explain engagement rate to clients who remember bounce rate?
Tell them engagement rate is the inverse of bounce rate, but with a more generous definition of engagement. Instead of measuring people who left immediately, it measures people who stayed, clicked around, or triggered a meaningful action. A 65 percent engagement rate means 65 percent of visitors actually engaged with the site. Most clients find that framing easy to work with.
What if a client asks about a metric I did not include?
Answer the question, explain why you left it out of the standard report, and offer to add it if it is relevant to their goals. Most of the time, clients are curious rather than insistent. Knowing you have access to the data and a reason for your choices is usually enough.
How do I handle a month where the numbers went down?
Report it honestly and include context. Seasonality, a technical issue that was since resolved, an algorithm update, or a pause in paid spend can all cause dips that have nothing to do with the quality of your work. Show the number, provide the explanation, and show the recovery trend if one has started. Transparency builds trust. Omitting bad news destroys it.
FREE GUIDE
5 Reporting Mistakes That Are Costing Your Agency Clients
The reporting errors that drive client churn, and how to fix them before your next monthly report.